Health and wellness is complex thing and needs a holistic approach in your lifestyle to achieve and maintain it . Food is an important pillar for your health and fitness. Complexity increases as we move into details of food items to classify what is healthy and what is unhealthy that too taking the consideration of health and fitness goal of an individual. Food that might be suggested for a particular fitness goal might not be a fit for other fitness goal. High carbs food might be preferred in the cases where weight gain is the fitness goal however things might be opposite when it comes to weight loss.
There are thousand and millions of food items in the world and our task was to classify and suggest food items while looking at users health and fitness objective. Also, algo should be able to give recommendation of healthy food for the item which user eats in his daily routine.
The problem statement we had was to prepare a diet chart for users based on their goals. Every goal had its own calorie requirements, percentages of primary nutrients i.e. carbohydrate, fat, protein, and fibres. It made a lot of sense in this context to group foods together based on these properties to classify them on the basis of them being a high carb, high protein or high fat food item. Hence we decided to analyse the data and create clusters out of it.
We divided out process in following steps:
- Reading, Understanding, and visualising data.
- Preparing data for modelling.
- Creating Model.
- Verifying accuracy of our model.
Lets get started by Reading and understanding Data.
We in total were provided with 1940 records having 88 attributes. Out of which, according to our business requirement we needed attributes like foodName, carbs, protein, fat, fibre, weight, calorie, saturatedFat and volume.
Several entries in our dataset had missing values there can be two reasons for it.
- It was intentionally left out as some food items don’t contain any such attributes. It simply means the missing values represents zero.
- There was some error collecting data and during data entry those values were skipped.
Upon consulting datasource we imputed missing values with zero.
Next the calorie in the food items contained calorie from all the minerals and nutrients components in our food but since we are only concerned about few of those nutrients so we calculate calories using those only. And according to standard formula the calories comes out as.
calorie = 4*carbs + 9*fat + 4*protein
Hence, we came up with a derived metrics calorie_calculated using the following formulae.
Standardising values:
Columns carbs, fat, protein and fibre are in grams but for our analysis purposes we need to convert and standardize those to its calories representation. And since fibre is a non contributor in calorie we convert it to corresponding content per unit weight of food item.
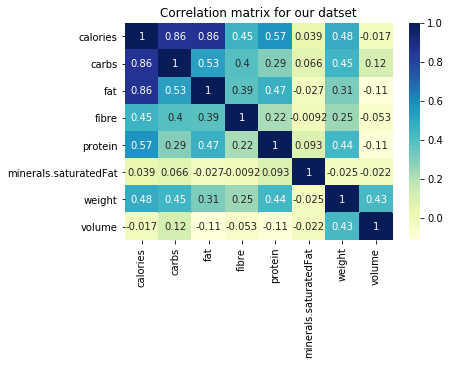
Its very important in clustering algorithm for our data to not be correlated. But as we see from the heatmap presented below that as calories of food items increases so does fat, carbs, protein. In order to remove this correlation we took a ration with the calculated calorie.
Now once our data is clean and correlations are handled lets move to next step i.e. clustering.
What is clustering?
Cluster is a task of grouping a set of objects in such a way that objects in the same group (called a cluster) are more similar (in some sense) to each other than to those in other groups (clusters). It is a main task of exploratory data mining, and a common technique for statistical data analysis, used in many fields, including machine learning, pattern recognition, image analysis, information retrieval, bioinformatics, data compression, and computer graphics.
Its a kind of Unsupervised Learning, as we don’t provide any labels to data and we are trying to distinguish data in subgroups based on the features provided.
What is K-Means Clustering ?
K-means is a centroid-based algorithm, or a distance-based algorithm, where we calculate the distances to assign a point to a cluster. In K-Means, each cluster is associated with a centroid. It tries to make intra-cluster datapoints as similar as possible while keeping the clusters as far as possible.
It involves following steps:
- choose number of clusters, lets say k. This is the k in K-Means clustering
- select k random points in data as centroid.
- Measure the distance between first point and K initial clusters.
- Assign the first point to the nearest cluster. And we do the same step 3 and 4 for the rest points. And once all the points are in cluster we move on to next step.
- Calculate the mean of each cluster i.e. centroid of each cluster.
- Now we measure the distance from the new centroid and repeat step to 6. Once the clustering didn’t change at all during the last iteration we are done.
We can asses the quality of clustering by adding up the variation within each cluster. Since k-means clustering cant see the best clustering, its only option is to keep track of these clusters, and their total variance, and do the whole thing over again with different starting points.
Since, K-Means rely heavily on the distance its very important for our features to be scaled with mean around zero and with unit standard deviation. And the best feature scaling technique to use in this case is Standardisation.
The next question is what should be the value of K ?
For this we use what is called Elbow Curve method. It gives a good idea what K value should be based on Sum of squared distance. We pick k at the spot where SSE starts to flatten out and forming an elbow.
import matplotlib.pyplot as plt
from sklearn.preprocessing import StandardScaler
from sklearn.cluster import KMeans

required_cols = ['carbs', 'fat', 'fibre', 'protein']

scalar = StandardScaler()
df[required_cols] = scalar.fit_transform(df[required_cols])
df[required_cols] = df[required_cols].fillna(0)
df[required_cols].info()

wcss = []
 for i in range(1, 11):
     kmeans = KMeans(n_clusters=i, init='k-means++', random_state=42, max_iter=300)
     kmeans.fit(df[required_cols])
     wcss.append(kmeans.inertia_)
 plt.plot(range(1, 11), wcss)
 plt.title('Elbow curve')
 plt.xlabel("Number of clusters")
 plt.ylabel('WCSS')
 plt.show()
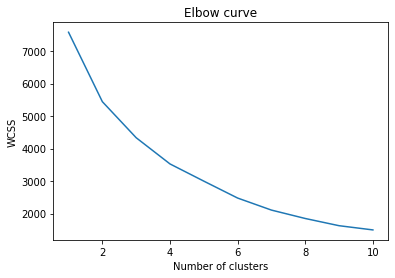
we get the above curve. From this we can say that optimal cluster and value of K should be around 4.
Analysis of Clustering
We are using Silhouette Analysis to understand the performance of our clustering.
Silhouette analysis can be used to determine the degree of separation between clusters. For each sample:
- Compute the average distance from all data points in the same cluster (ai).
- Compute the average distance from all data points in the closest cluster (bi).
- Compute the coefficient:
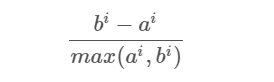
The coefficient can take values in the interval [-1, 1].
- If it is 0 –> the sample is very close to the neighboring clusters.
- It it is 1 –> the sample is far away from the neighboring clusters.
- It it is -1 –> the sample is assigned to the wrong clusters.
Therefore, we want the coefficients to be as big as possible and close to 1 to have a good clusters. Lets analyse the silhouette score in our case.
result = {}
for i in range(2, 11):
    kmeans = KMeans(n_clusters=i, init='k-means++', random_state=42, max_iter=300, n_init=10)
    kmeans.fit(df[required_cols])
    pred = kmeans.predict(df[required_cols])
    result[i] = silhouette_score(df[required_cols], pred, metric='euclidean')

print(result)
We get result as:
{2: 0.31757107035913174, 3: 0.34337412758235525, 4: 0.3601443169380033, 5: 0.2970926954241235, 6: 0.29883645610373294, 7: 0.3075310165352718, 8: 0.313105441606524, 9: 0.2902622193837789, 10: 0.29641563619062317}We can clearly see that for k = 4 we have the highest value of silhouette score. Hence 4 as an optimal value of K is a good choice for us.
Once we have k; we performed K-Means and formulated our cluster.
Next, we have prediction for values. Let’s say, we get nutrition composition for a specific goal. What we do, is scale that data in format that out model accepts and predict the cluster of the corresponding given composition.
y_pred = model.predict([food_item])
label_index = np.where(model.labels_ == y_pred[0])
As we get the label_index we filter out our food from our data and calculate the euclidian distance of each food item for the given composition.
dist = [np.linalg.norm(df[index] - food_item) for index in label_index[0]]By this way, we can have the food items that are very closely related to the provided composition. And hence, we can prepare the diet the way we want. Like if we want to further filter out the data obtained from clustering into veg/NonVeg type etc we can perform those filtering.
The above content is an outcome of our experience while working with above problem statement. Please do feel free to reach out and comment in case of any feedback and suggestion.
Photo by Lily Banse on Unsplash
