
Our Engineering team at HealthKart has a keen focus on improving the performance and making the system scalable for better user experience. Our Mobile Development team encountered couple of bottlenecks which was causing the issue on the performance side and hence a bad user experience score on the different performance metrics. Few of the important matrices that result in bad user experience were for example TTID, Slow start over time, Hot Start Over time, Activity Navigation Time etc.
Lets get started to understand these matrices and how we improved these for better user experience.
Bottlenecks for Performance – TTID is the Core Metrics
The Time to Initial Display (TTID) metric refers to the time it takes for an Android application to display its first frame to the user. This metric includes several factors, such as process initialization, activity creation, and loading of necessary resources, and it can vary depending on whether the application is starting from a cold or warm state.
If the application is starting from a completely closed state, meaning it’s a cold start-up, the TTID metric will include the time it takes for the system to initialize the application’s processes and load the necessary resources before displaying the first frame. This initial startup time can take longer than a warm start-up as the app has to load everything from scratch. In our case, the startup time was observed to be 2.57 seconds, which likely includes the time it takes to complete a cold start-up.
If the application is already running in the background or has been temporarily closed, meaning it’s a warm start-up, the TTID metric will still include the time it takes to create the activity and display the first frame, but some of the necessary resources may already be loaded in the device’s memory. Therefore, warm start-up time is generally faster than cold start-up time but still contributes to the overall TTID metric.
Android Profiler – Profiler tools which tells where do you stand
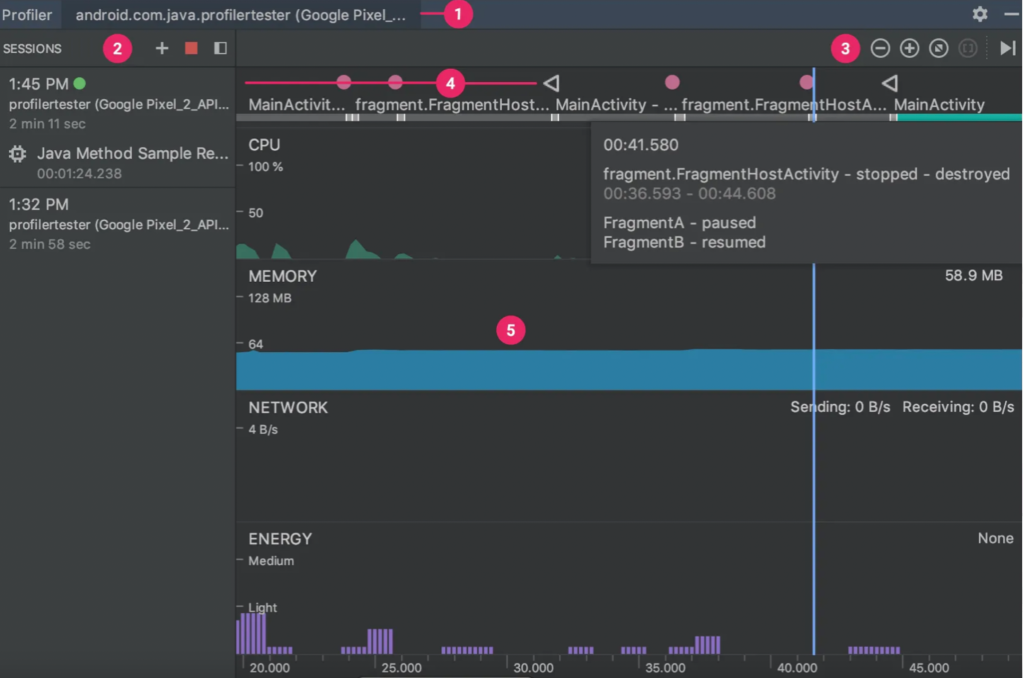
Android Profiler: This is a tool built into Android Studio that provides real-time data on app performance, including start-up times. You can use it to profile your app on a device or emulator, and it will give you detailed information on the start-up process, including the TTID metric you mentioned earlier. To access the profiler, go to the “View” menu in Android Studio, and select “Profiler”. These tools show us real-time graphs of our app’s memory use and allow us to capture a heap dump, force garbage collections, and track memory allocations.
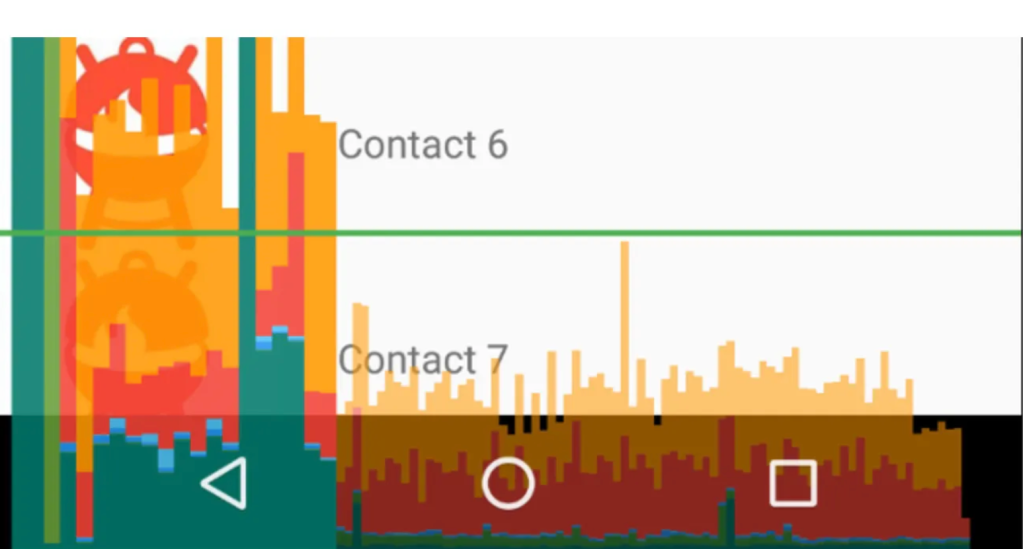
After observing the code blocks, we worked to remove cases of memory leaks. Our team also worked to improve the view rendering time of every module/screen in the application. We first analyzed the time taken by each view to be drawn using the Profile GPU Rendering tool. This tool displays a scrolling histogram, which visually represents how much time it takes to render the frames of a UI window relative to a benchmark of 16ms per frame.
Reducing Android App Start-up Time with Baseline Profiling, Microbenchmarking, and App Startup Library
We integrated baseline profiling and microbenchmarking into our application to reduce this time. Baseline profiling improves code execution speed by around 30% from the first launch by avoiding interpretation and just-in-time (JIT) compilation steps for included code paths.
To generate and install a baseline profile, you must use at least the minimally supported versions of the Android Gradle Plugin, Macrobenchmark library, and Profile Installer. The baseline profile generates human-readable profile rules for the app and is compiled into binary form in the app (they can be found at assets/dexopt/baseline.prof).
We also used the App Startup library, which provides a performant way to initialize components at application startup instead of doing it manually and blocking the main thread.
By taking advantage of the above measures we improved following –
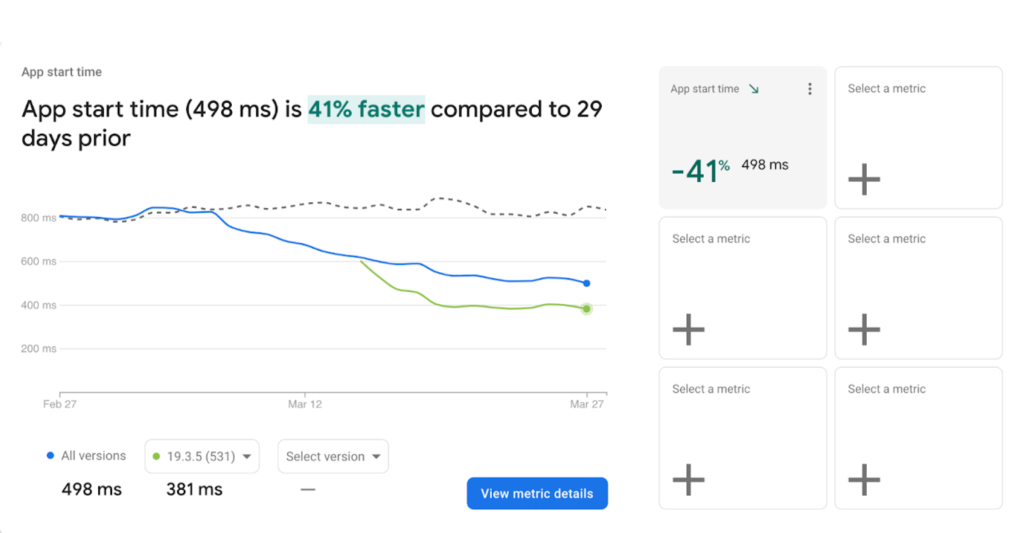
App startup speed improved by 41%
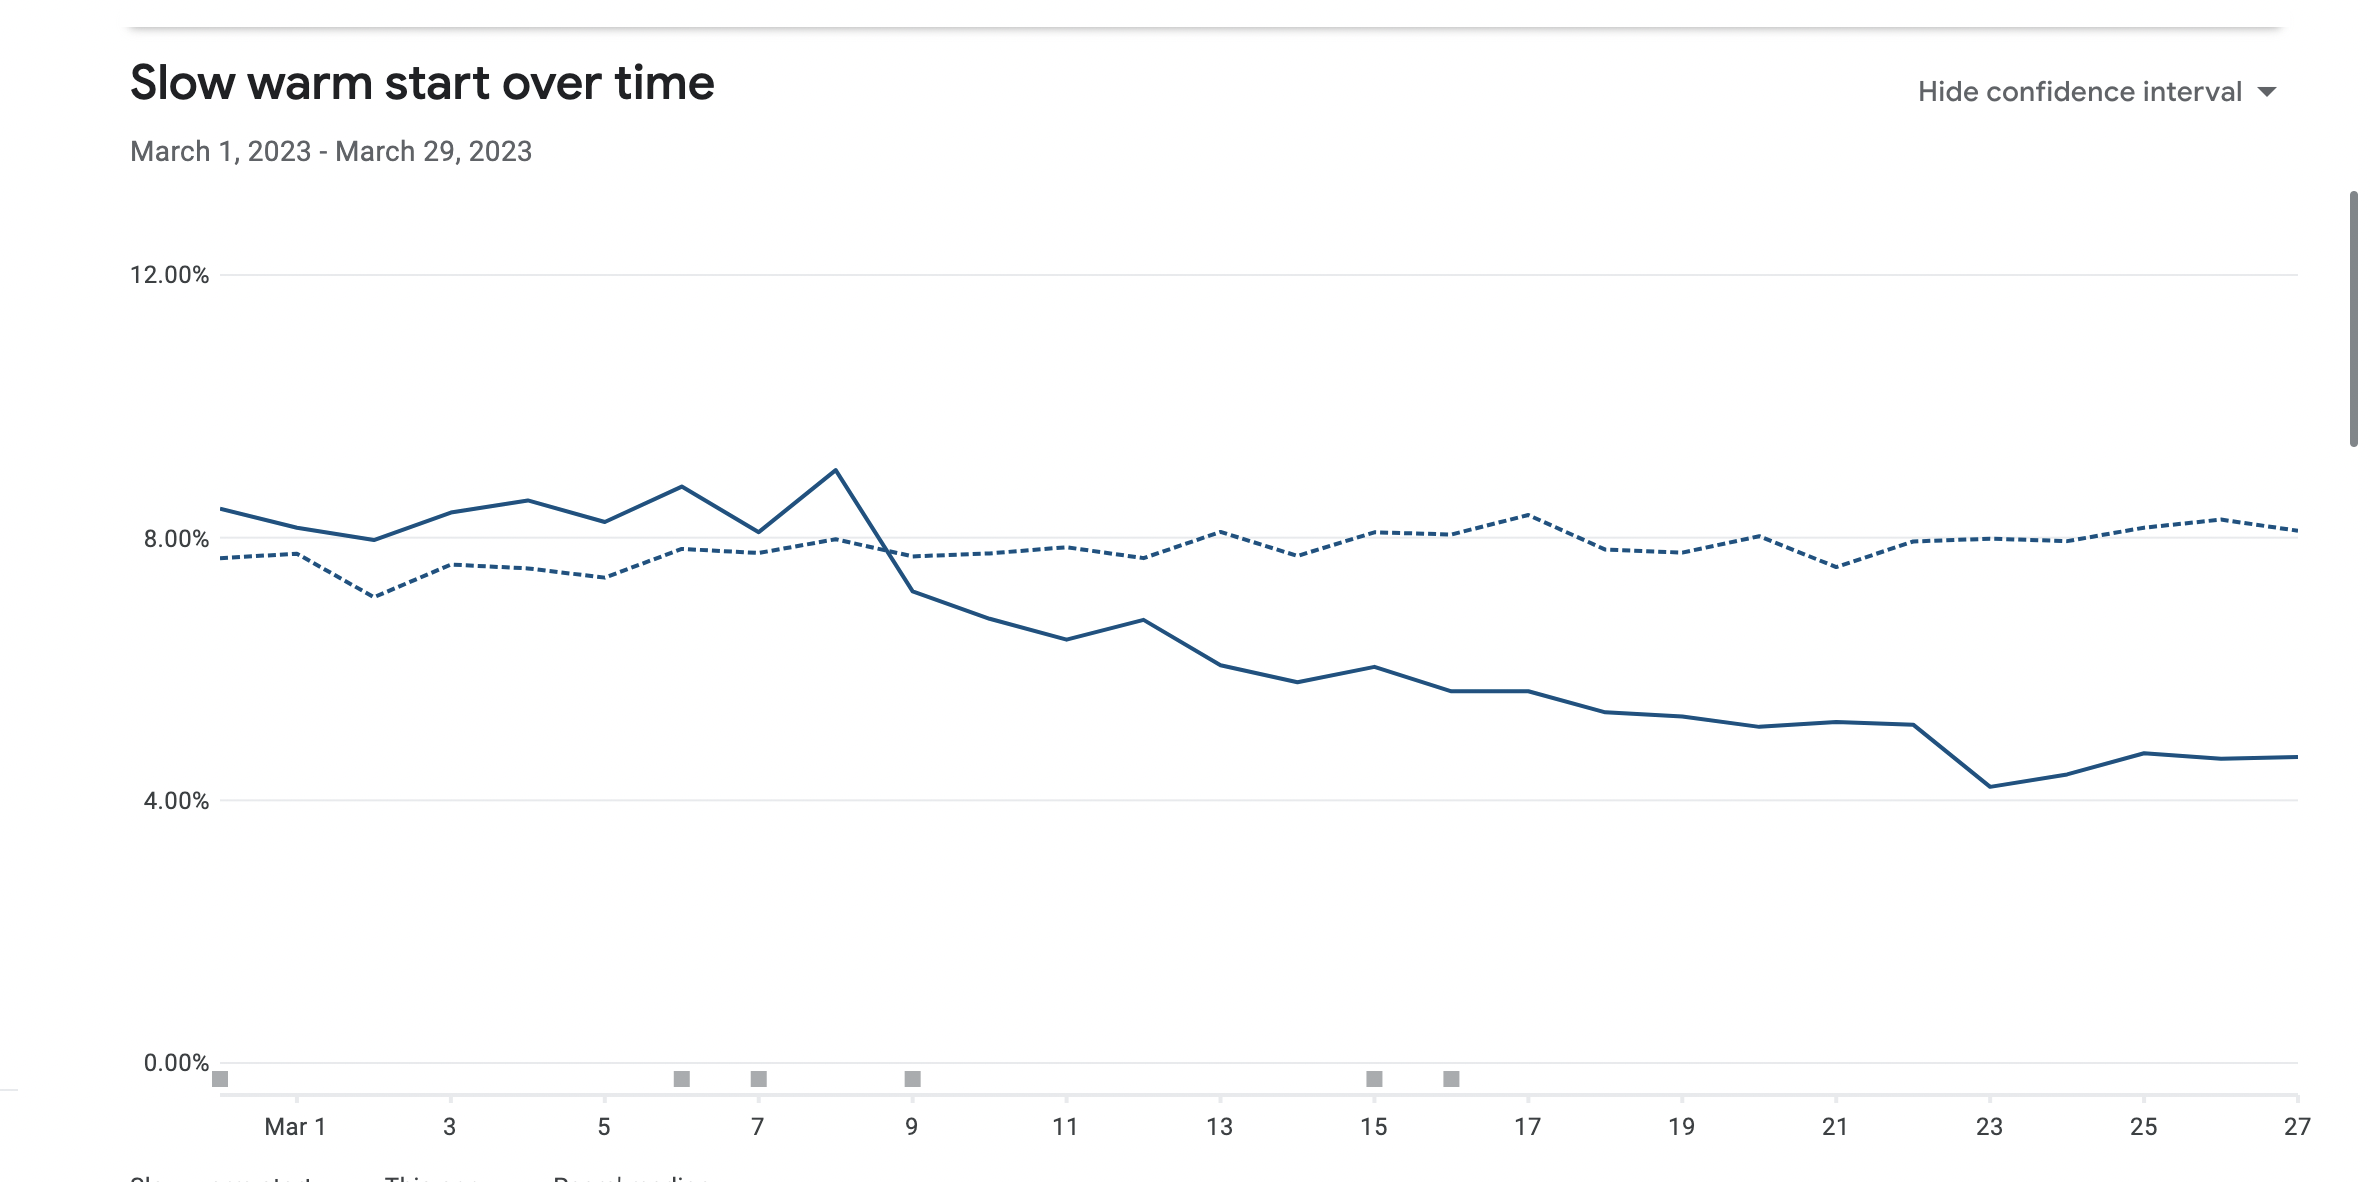
Slow warm start over time was improved by 50%
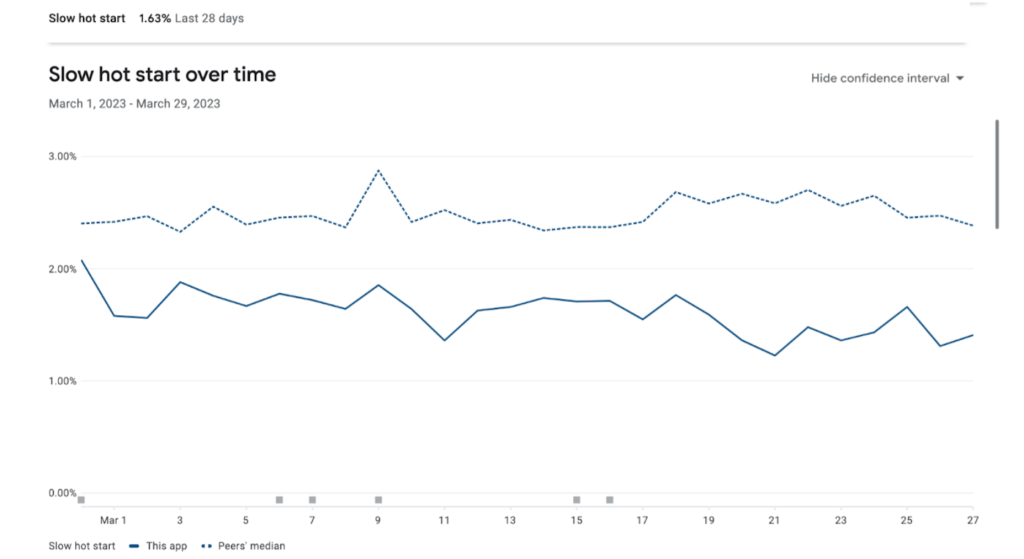
Slow hot start over time was improved by 30%.
Migrating to Android Jetpack Compose – For Smother Navigation between Activities
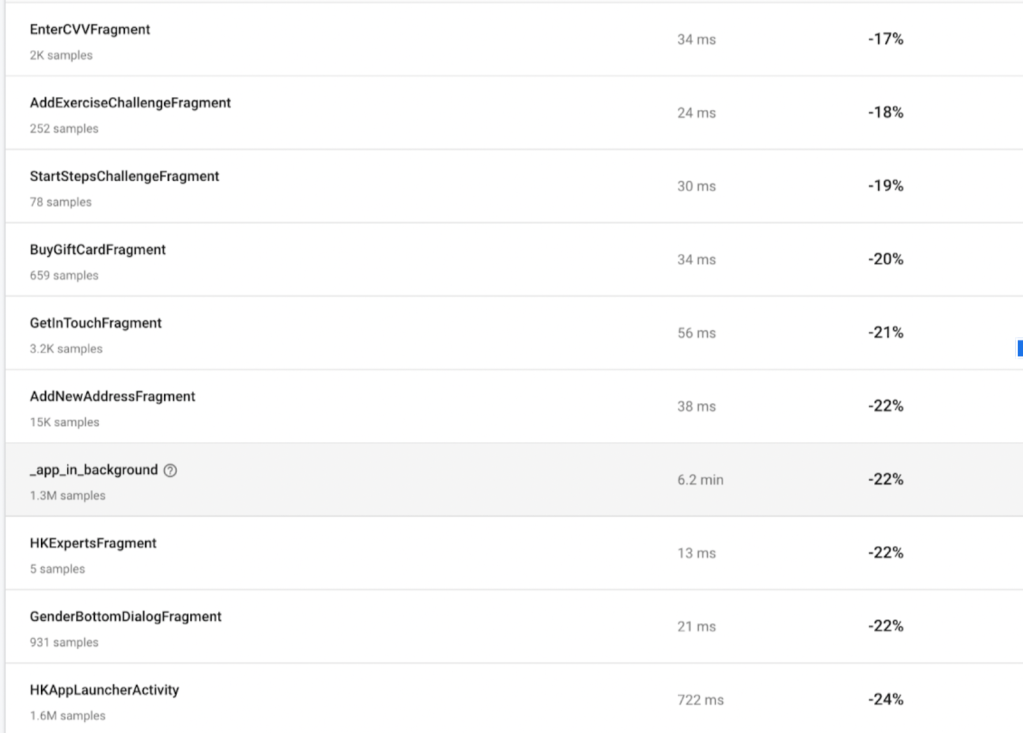
We migrated our application development from declarative to imperative development by developing it with Android Jetpack Compose, which uses the concept of recomposition. This also removes boilerplate code, makes debugging and testing easier, and results in a more smother navigation inside the application. See below the different activity navigation time that was reduced after migrating to compose framework.
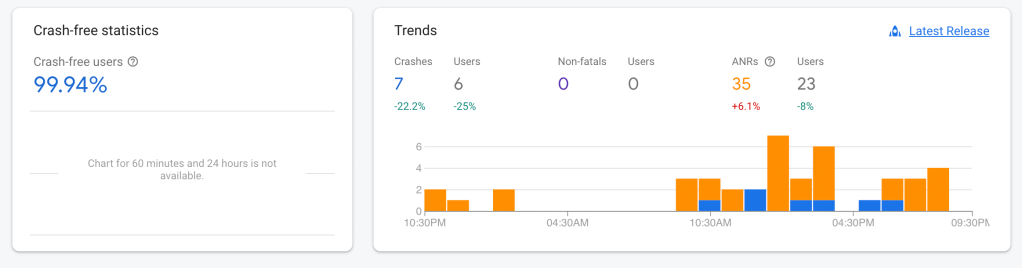
These steps also helped increase the number of crash-free users for our application, resulting in performance improvement
Here are some links to help you migrate from XML to Android Compose.
https://developer.android.com/jetpack/compose/migration
https://github.com/android/compose-samples/tree/main/Jetcaster
https://developer.android.com/jetpack/compose/preview
The above outcome is a result of our experience and might differ from case to case basis. We would love to hear about your experience and any suggestion or feedback on above.
Photo by Sajad Nori on Unsplash
